Tests for independence between labels and covariates using permutation of cells
Source:R/permutation-testing.R
cluster_permute_test.RdThis tests a statistic for association between labels (for instance, cluster/clonal ID) and covariates (for instance, subject or treatment) by permuting the link between the two.
Each observation represents a cell.
statistic is any function of labels
cluster_permute_test(
  ccdb,
  cell_covariate_keys,
  cell_label_key = ccdb$cluster_pk,
  cell_stratify_keys,
  statistic,
  contrasts = NULL,
  n_perm,
  alternative = c("two.sided", "less", "greater"),
  sanity_check_strata = TRUE,
  ...
)
Arguments
- ccdb
ContigCellDB- cell_covariate_keys
characternaming fields inccdb$cell_tbl- cell_label_key
characternaming a single field inccdb$cell_tbl- cell_stratify_keys
optional
characternaming fields inccdb$cell_tblunder which permutations ofcell_label_keywill occur. This means that the test will occur conditional on these covariates. Must be disjoint fromcell_covariate_keys.- statistic
function of label (vector) and covariate (data.frame). If this returns a vector, then by default each level will be compared against each other, pairwise, but see the next section.
- contrasts
an optional list of numeric vectors. Each will be dotted with the statistic, or optionally a matrix provided in which case each row would be tested one-by-one.
- n_perm
number of permutations to run
- alternative
characternaming the directionstatisticshould be fall under the alternative hypothesis- sanity_check_strata
logical, shouldcell_stratify_keysbe checked for sanity?- ...
passed to
statistic
Value
a list containing the observed value of the statistic, the permuted values of the statistic, its expectation (under independence), a p-value, and the Monte Carlo standard error (of the expected value).
See also
Examples
library(dplyr)
# covariate should name one or more columns in `cell_tbl`
cluster_idx = c(1, 1, 1, 2, 2, 3, 3)
subject = c('A', 'A', 'B', 'B', 'B', 'C', 'C')
contig_tbl = tibble(contig_pk = seq_along(cluster_idx), cluster_idx, subject)
ccdb_test = ContigCellDB(contig_tbl = contig_tbl, contig_pk = 'contig_pk',
cell_pk = c('contig_pk', 'subject', 'cluster_idx'), cluster_pk = 'cluster_idx')
ccdb_test$cell_tbl
#> # A tibble: 7 × 3
#> contig_pk subject cluster_idx
#> <int> <chr> <dbl>
#> 1 1 A 1
#> 2 2 A 1
#> 3 3 B 1
#> 4 4 B 2
#> 5 5 B 2
#> 6 6 C 3
#> 7 7 C 3
clust_test = cluster_permute_test(ccdb_test, 'subject', 'cluster_idx',
statistic = purity, n_perm = 50)
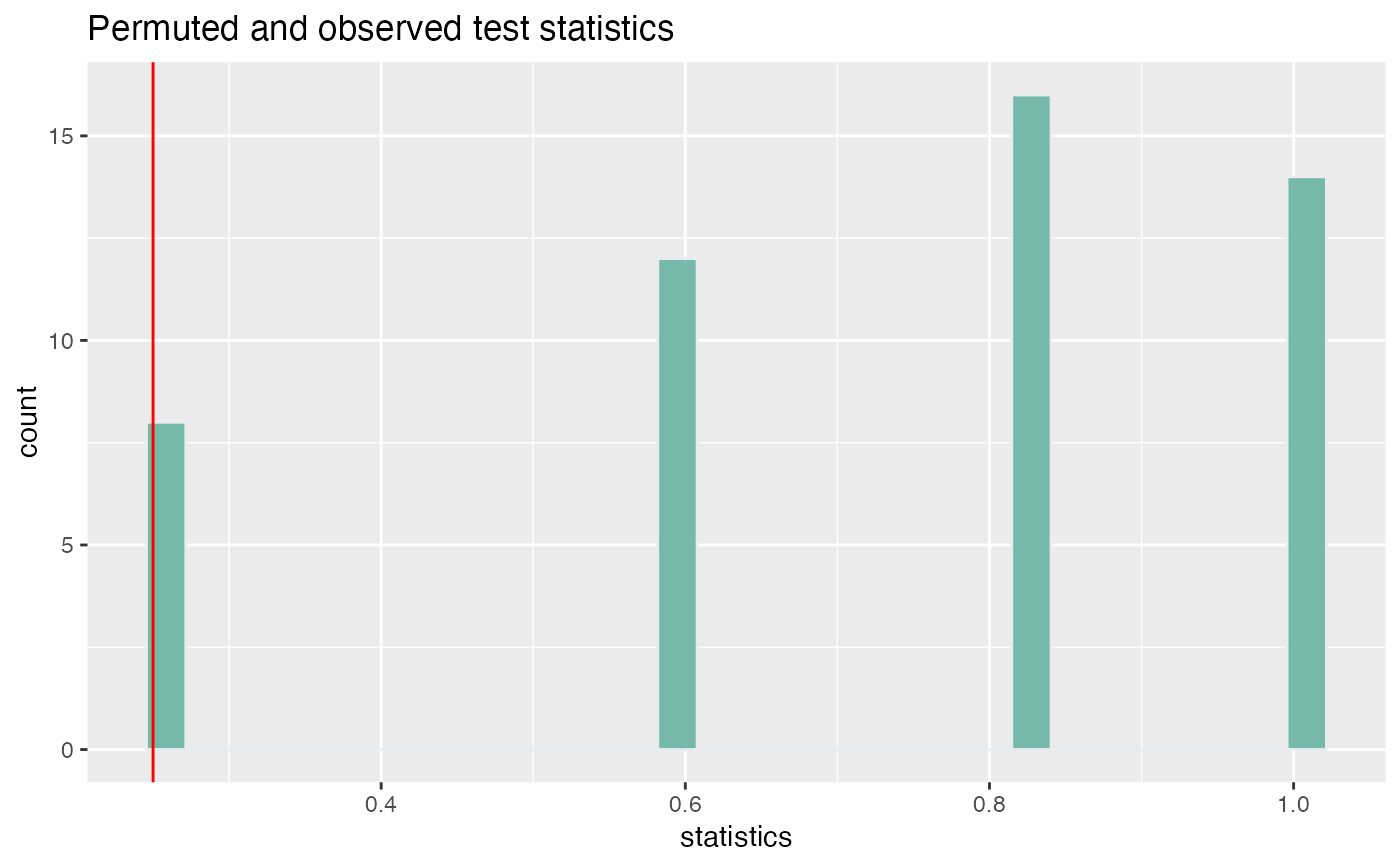
library(ggplot2)
plot_permute_test(perm_test = clust_test)
#> Loading required namespace: cowplot
#> `stat_bin()` using `bins = 30`. Pick better value with `binwidth`.
 tidy.PermuteTest(clust_test)
#> # A tibble: 50 × 5
#> statistics observed expected p.value mc.se
#> <dbl> <dbl> <dbl> <dbl> <dbl>
#> 1 0.6 0.25 0.731 0.02 0.0364
#> 2 1 0.25 0.731 0.02 0.0364
#> 3 0.25 0.25 0.731 0.02 0.0364
#> 4 0.6 0.25 0.731 0.02 0.0364
#> 5 0.6 0.25 0.731 0.02 0.0364
#> 6 1 0.25 0.731 0.02 0.0364
#> 7 0.833 0.25 0.731 0.02 0.0364
#> 8 0.6 0.25 0.731 0.02 0.0364
#> 9 0.25 0.25 0.731 0.02 0.0364
#> 10 0.833 0.25 0.731 0.02 0.0364
#> # … with 40 more rows
tidy.PermuteTest(clust_test)
#> # A tibble: 50 × 5
#> statistics observed expected p.value mc.se
#> <dbl> <dbl> <dbl> <dbl> <dbl>
#> 1 0.6 0.25 0.731 0.02 0.0364
#> 2 1 0.25 0.731 0.02 0.0364
#> 3 0.25 0.25 0.731 0.02 0.0364
#> 4 0.6 0.25 0.731 0.02 0.0364
#> 5 0.6 0.25 0.731 0.02 0.0364
#> 6 1 0.25 0.731 0.02 0.0364
#> 7 0.833 0.25 0.731 0.02 0.0364
#> 8 0.6 0.25 0.731 0.02 0.0364
#> 9 0.25 0.25 0.731 0.02 0.0364
#> 10 0.833 0.25 0.731 0.02 0.0364
#> # … with 40 more rows