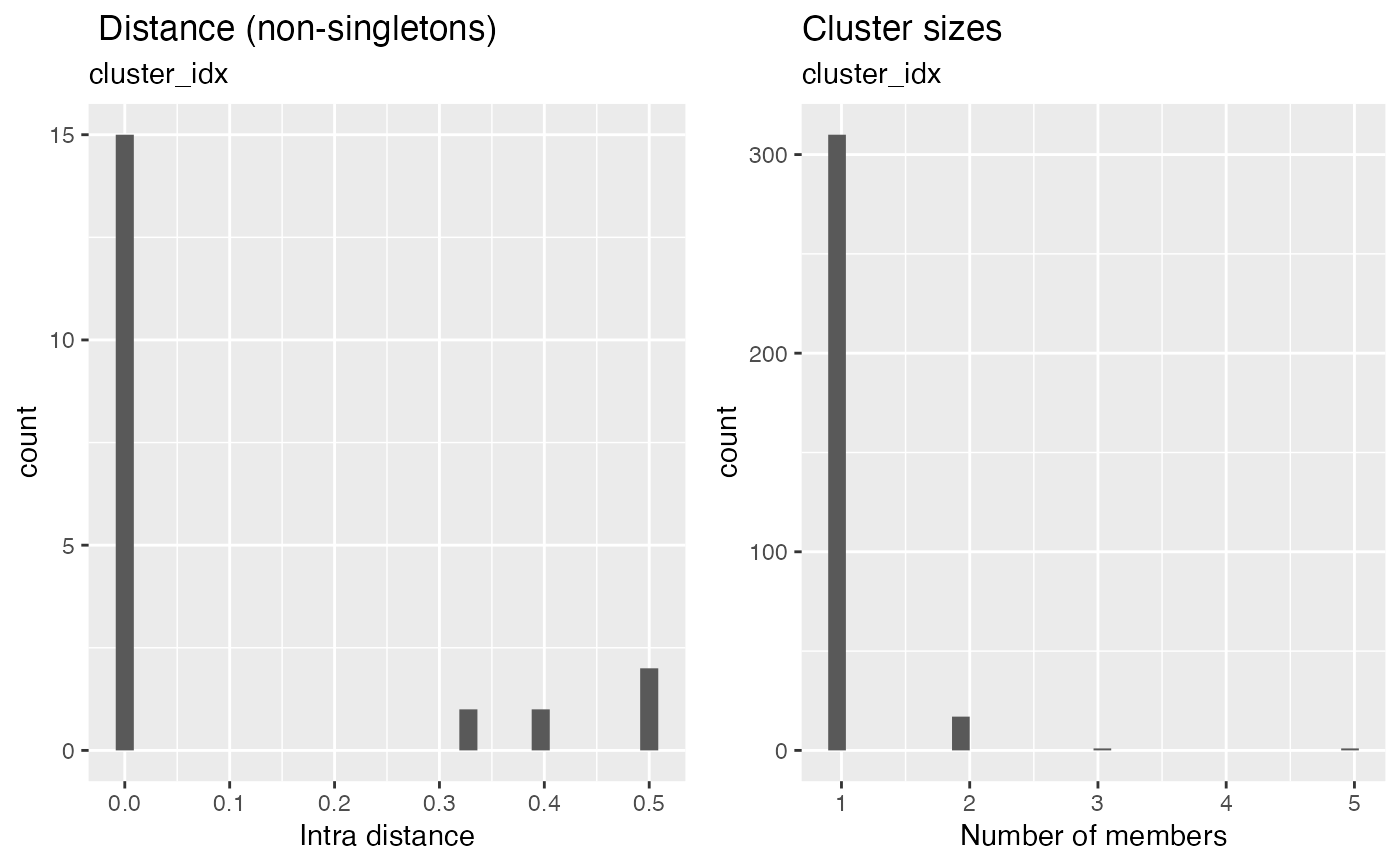
The number of elements per cluster and the average distance between the medoid and other elements are plotted.
cluster_plot(cdb, return_plotlist = FALSE)Arguments
- cdb
A
fine_clusteringContigCellDBobject- return_plotlist
should a list of
ggplot2plots be returned. If FALSE, acowplotcomposite is retuned.
Value
a cowplot composite or a list of plots.
Examples
library(dplyr)
data(ccdb_ex)
ccdb_ex_small = ccdb_ex
ccdb_ex_small$cell_tbl = ccdb_ex_small$cell_tbl[1:200,]
ccdb_ex_small = cdhit_ccdb(ccdb_ex_small,
sequence_key = 'cdr3_nt', type = 'DNA', cluster_name = 'DNA97',
identity = .965, min_length = 12, G = 1)
ccdb_ex_small = fine_clustering(ccdb_ex_small, sequence_key = 'cdr3_nt', type = 'DNA')
#> Calculating intradistances on 329 clusters.
#> Summarizing

# Canonicalize with the medoid contig is probably what is most common
ccdb_medoid = canonicalize_cluster(ccdb_ex_small)
#> Filtering `contig_tbl` by `is_medoid`, override by setting `contig_filter_args == TRUE`

# But there are other possibilities.
# To pass multiple "AND" filter arguments must use &
ccdb_umi = canonicalize_cluster(ccdb_ex_small,
contig_filter_args = chain == 'TRA' & length > 500, tie_break_keys = 'umis',
contig_fields = c('chain', 'length'))
#> Subset of `contig_tbl` has 157 rows for 329 clusters. Filling missing values and breaking ties
#> with umis.
ccdb_umi$cluster_tbl %>% dplyr::select(chain, length) %>% summary()
#>     chain               length
#>  Length:329         Min.   : 503.0
#>  Class :character   1st Qu.: 558.0
#>  Mode  :character   Median : 607.0
#>                     Mean   : 620.0
#>                     3rd Qu.: 665.5
#>                     Max.   :1006.0
#>                     NA's   :186
cluster_plot(ccdb_ex_small)
#> `stat_bin()` using `bins = 30`. Pick better value with `binwidth`.
#> `stat_bin()` using `bins = 30`. Pick better value with `binwidth`.