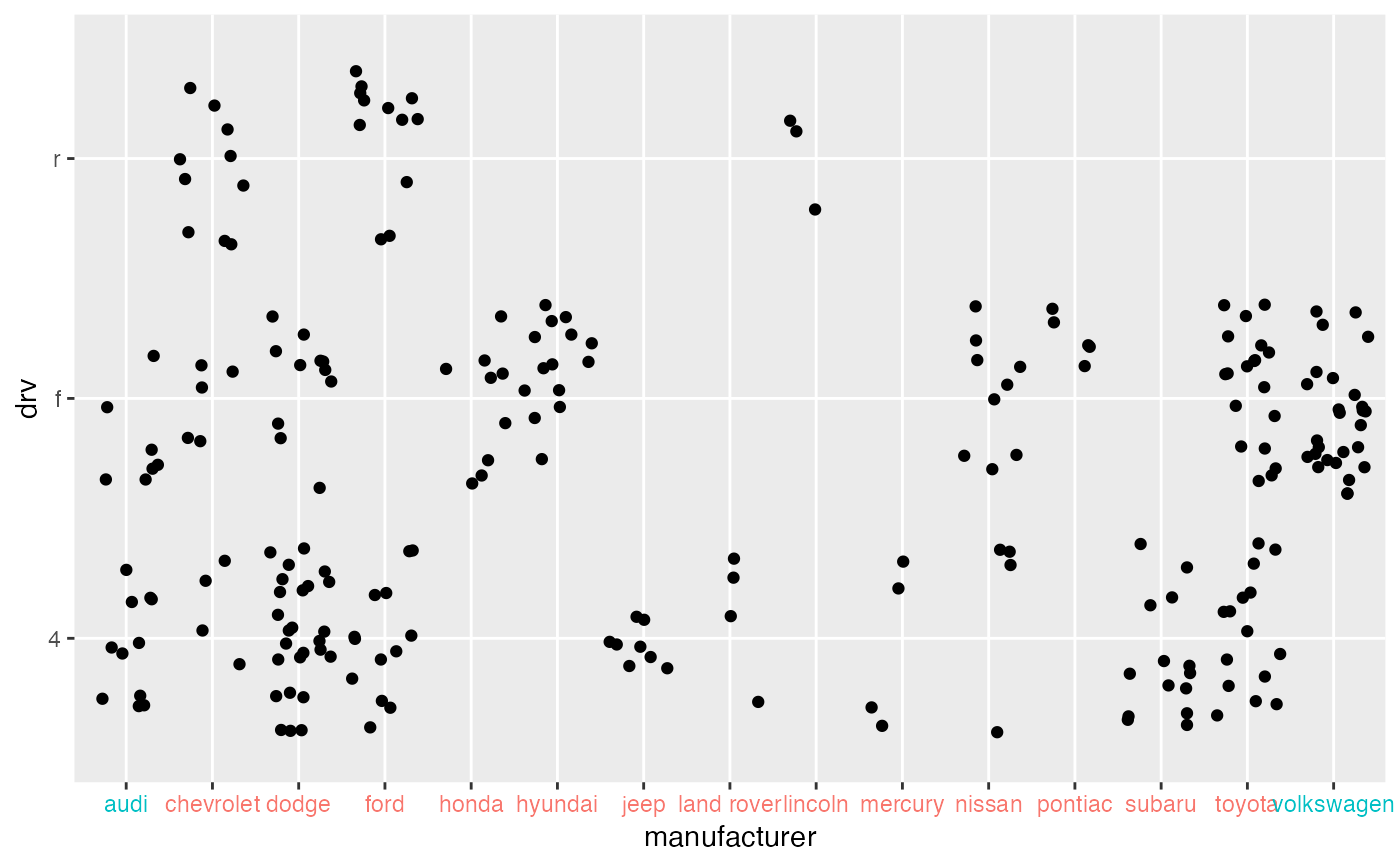
Color axis labels
map_axis_labels(
  plt,
  label_data_x = NULL,
  label_data_y = NULL,
  aes_label,
  scale = ggplot2::scale_color_hue(aesthetics = "axis_color")
)
Arguments
- plt
ggplot2::ggplot()object- label_data_x
data.frame()containing the mapping between x-axis labels andaes_label- label_data_y
data.frame()containing the mapping between y-axis labels andaes_label- aes_label
character or bare symbol giving the column in
label_datato be mapped- scale
ggplot2discrete color
Value
plt with axis text modified
