With factors, a pair of variables present in the contig_tbl and the cluster_tbl,
generate and plot cross-tabs of the number of contigs, or its pearson residual.
Arguments
- ccdb
A ContigCellDB object.
- factors
characterlength 2 of fields present- type
Type of visualization, a heatmap or a node-edge network plot
- statistic
Cluster characteristics visualized by pearson residuals or raw contig counts
- ncluster
integer. Omit factors that occur less thannclusters. For clarity of visualization.- chaintype
Character in ccdb$contig_tbl$chain. If passed will subset contigs belonging to specified chain (IGH,IGK,IGL,TRA,TRB)
Value
A ggraph object if type == 'network', and a ggplot object if type == 'heatmap'
See also
canonicalize_cluster to "roll-up" additional contig variables into the `cluster_tbl``
Examples
library(ggraph)
data(ccdb_ex)
ccdb_germline_ex = cluster_germline(ccdb_ex, segment_keys = c('v_gene', 'j_gene', 'chain'),
cluster_pk = 'segment_idx')
ccdb_germline_ex = fine_clustering(ccdb_germline_ex, sequence_key = 'cdr3_nt', type = 'DNA')
#> Calculating intradistances on 707 clusters.
#> Summarizing
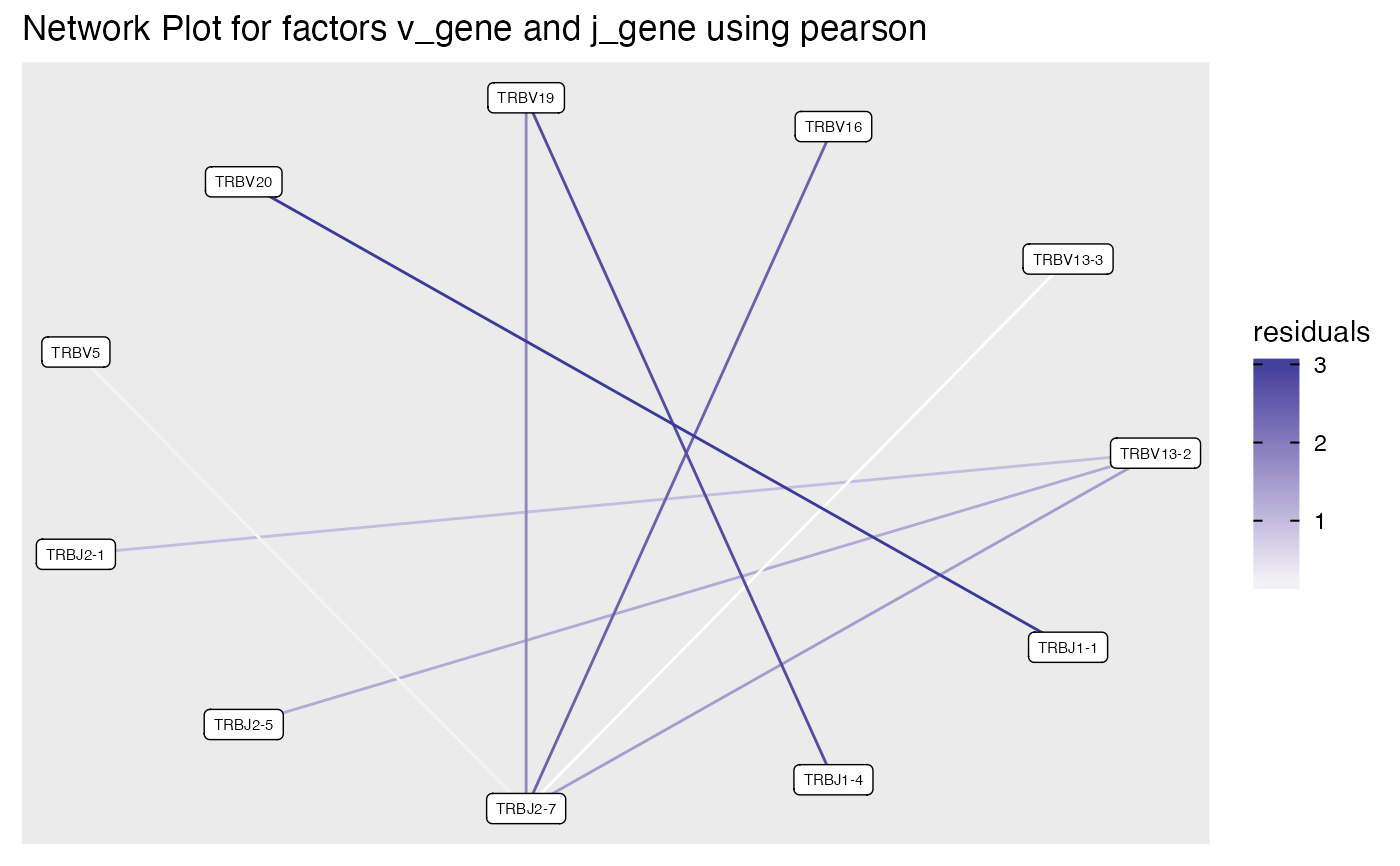
plot_cluster_factors(ccdb_germline_ex,factors = c('v_gene','j_gene'),
statistic = 'pearson', type = 'network' ,ncluster = 10, chaintype = 'TRB')
#> Warning: Chi-squared approximation may be incorrect
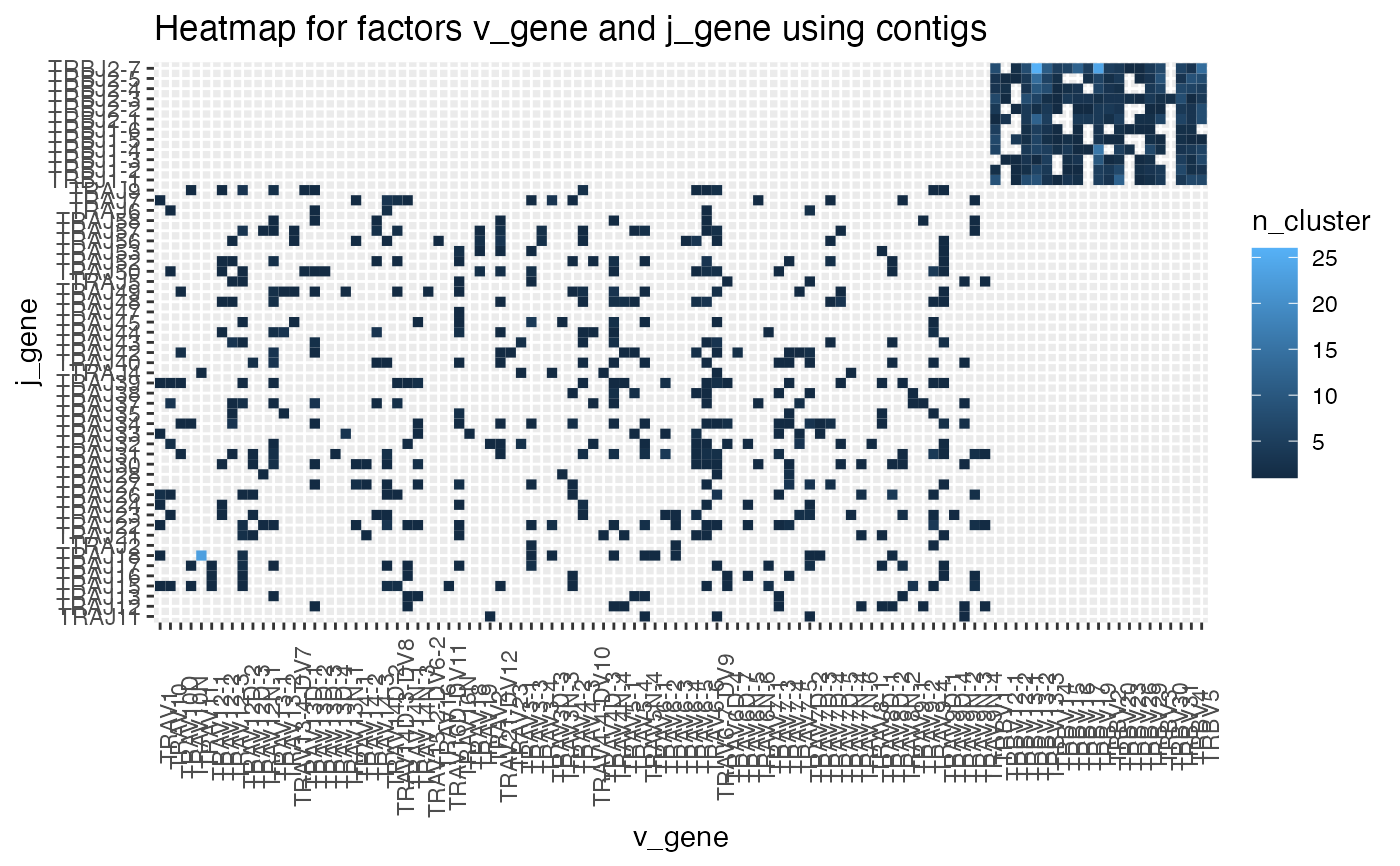
 plot_cluster_factors(ccdb_germline_ex,factors = c('v_gene','j_gene'),
statistic = 'contigs', type = 'heatmap')
plot_cluster_factors(ccdb_germline_ex,factors = c('v_gene','j_gene'),
statistic = 'contigs', type = 'heatmap')
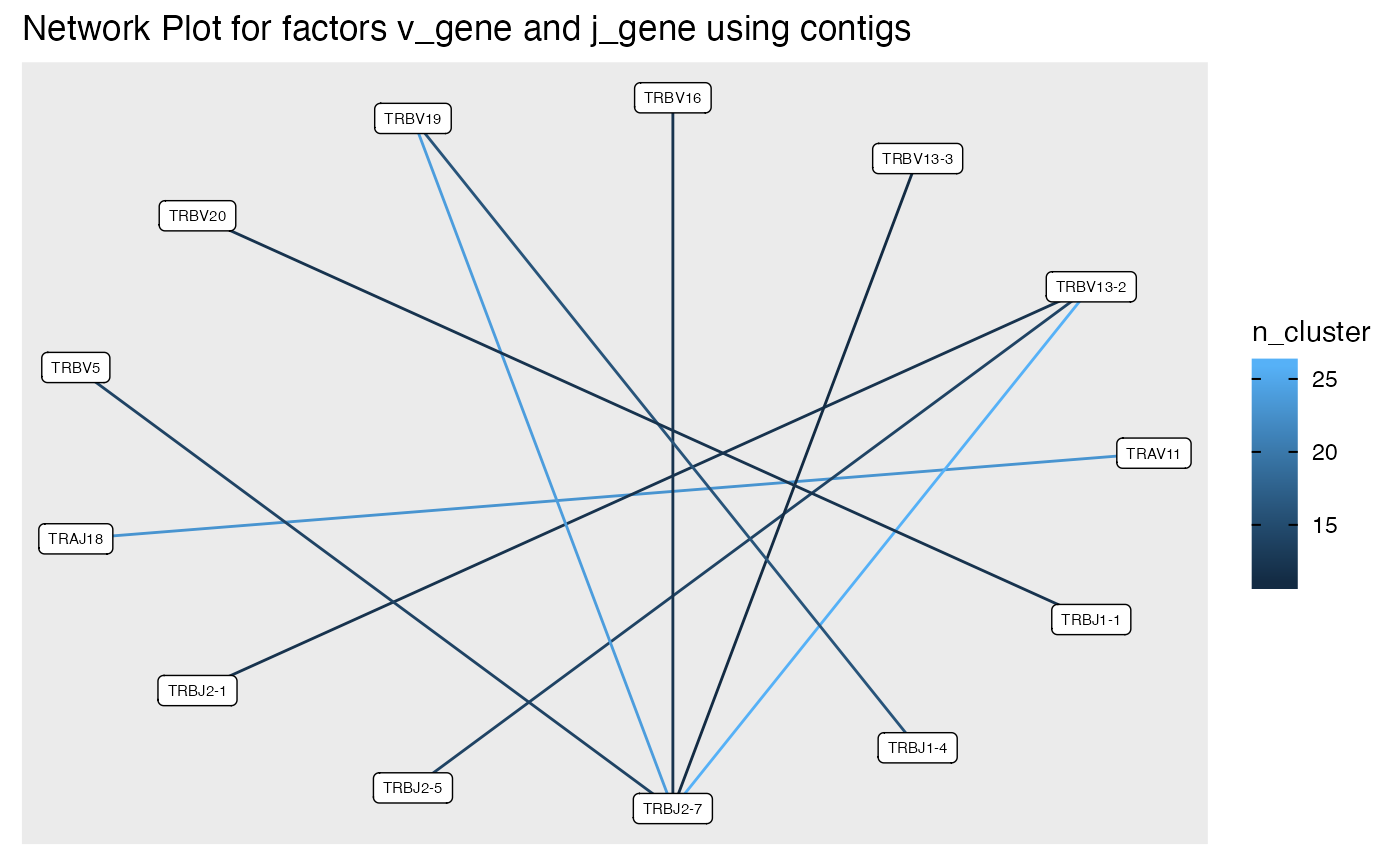
 plot_cluster_factors(ccdb_germline_ex,factors = c('v_gene','j_gene'),
statistic = 'contigs', type = 'network', ncluster = 10)
plot_cluster_factors(ccdb_germline_ex,factors = c('v_gene','j_gene'),
statistic = 'contigs', type = 'network', ncluster = 10)